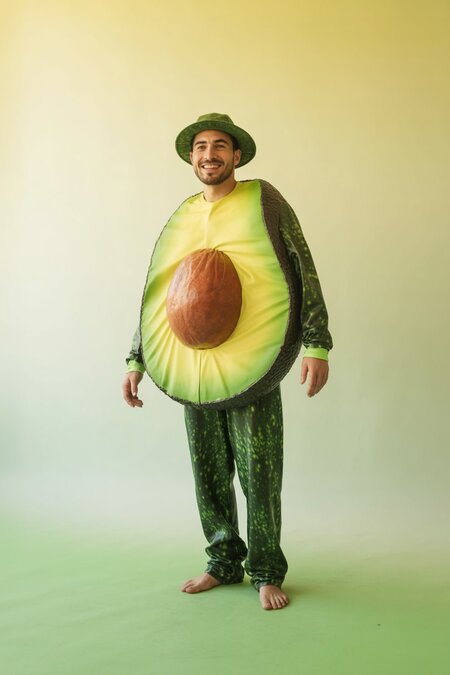
Description
Millennials love avocado toast and often continue to live with their parents, delaying the purchase of their own home—partially due to the high cost of avocados. However, if they can find a city where avocados are cheaper, they have a chance to get closer to their «American dream.»
(I’m not a Millennial, but I love avocado too 🥑)
Data was sourced from the Hass Avocado Council website in May 2018 and is presented in a CSV file format. The table reflects weekly retail sales figures for Hass avocados in 2018, compiled from actual Point of Sale data. Since 2013, various retail channels have been covered, including grocery stores, supermarkets, and other points of sale. The average price indicates the cost of a single avocado, and PLU codes are used exclusively for Hass variety avocados.
Data Source — kaggle.
I generated the cover using AI (Ideogram).
To create the color palette for the diagrams, I used Adobe Color and sampled colors directly from the avocado on the final cover.
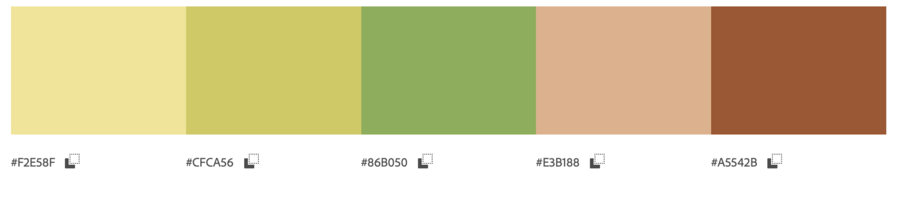
Color Palette
Database Processing and Visualization
First, I imported the libraries and code. The array analytics are the most complete, and you can view them in the notepad file.
I chose the Montserrat font.
I tried making different charts to make it look more interesting.
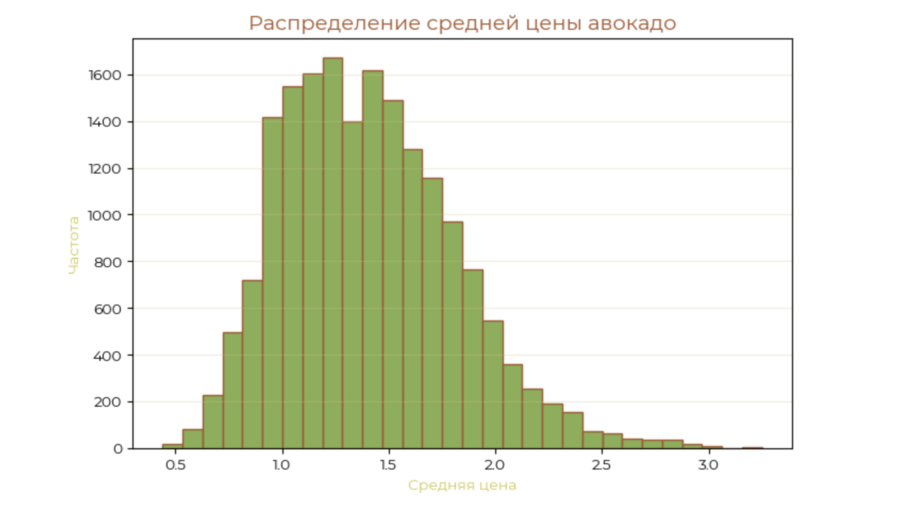
Histogram
The average price of a fruit ranges from $0.4 to $3.6. However, the most common average price for an avocado per piece ranges from $1 to $1.7.
Histogram Code
Bar Plot
The average price of organic avocado is noticeably higher than that of regular avocado—this is clearly visible in the bar chart, where a separate column is constructed for each type using the project’s signature color palette. This result indicates that the organic product is positioned as more premium and expensive, which is also supported by market observations—organic products traditionally cost more due to production and certification requirements. Overall, the difference in average price between avocado types reflects the specifics of supply and demand in the market, as well as consumer preferences.
Bar chart code
Bar Plot
The lowest price was recorded in 2016. The highest was in 2017.
Bar chart code
Pie Chart of Traditional vs. Organic Avocado Sales Share
This chart illustrates the high popularity of traditional avocado. The traditional type is popular because it contains GMOs and is less expensive; conversely, organic avocado does not contain GMOs, resulting in a higher price and lower demand.
Pie chart code
Emission Charts (Boxplot)
The charts show the following: Boxplot for AveragePrice: There are outliers at the upper end of the distribution, indicating instances of very high avocado prices. The bulk of the prices falls within the range of $1.10 — $1.66, suggesting relatively stable prices, aside from the extreme values. The maximum and minimum prices without outliers are $2.5 and $0.5, respectively. Values outside of these ranges can be considered outliers. Boxplot for Total Volume: Significant outliers are present in the upper range, suggesting a considerable number of cases with abnormally large sales volumes. Because most values of the Total Volume feature are close to zero and due to the abnormally high outliers, the values for the boundaries and quartiles are approximately the same and close to 0.
Correlation Schedule
Strong linear correlation between attributes: Total Bags and Small Bags Correlation coefficient between them: 0.969614
Correlation Chart Code
Data analysis results concerning avocado pricing and sales clearly demonstrate that this product market is highly diverse and influenced by numerous factors. The visualizations revealed a consistent distinction between conventional and organic avocados: the organic product is steadily more expensive and exhibits greater price volatility, a finding supported by both the median and the number of outliers on the box plots. Bar charts reflect the dynamics of average prices by year and type, allowing one to track market trends and identify periods of cost growth or decline. Pie charts and correlation matrices help assess the market structure and the relationships between key indicators, making complex data accessible for rapid analysis and decision-making. Overall, the comprehensive infographic transforms massive sets of numbers into a coherent and understandable picture, where each graph contributes to the overall conclusion: the avocado market is dynamic, sensitive to product type and seasonal fluctuations, and skilled visual analysis helps uncover trends, anomalies, and growth opportunities for future development.
Description of Generative Model Application
Cover Prompt:
Generate a photo of a person (a man) who is approximately 27 years old, dressed in an avocado suit. Full-body shot. The man is smiling. Realism style. Aspect ratio 3:2.
Codebook and Dataset